- Hours saved does not become money until the time is redirected, says nothing about quality, and is usually estimated rather than measured.
- Four measures cover almost everything: cost per task before and after, error and rework rate, time to resolution, and revenue or retention impact where the link is real.
- Every one of them needs a baseline captured before launch. A week or two of tracking with the timestamps your systems already produce is enough.
Most conversations about the return on AI automation start and end with one number: hours saved. Someone reports that a new agent saves the team twenty hours a week, everyone nods, and the project is filed under success. Six months later, when someone asks what the company actually got back for the money, nobody has a clean answer. That gap is the biggest reason AI projects lose support after a promising start. The automation worked. Nobody set up the numbers to prove it.
Why “hours saved” is not enough
It is easy to measure and easy to explain, which is exactly why it becomes the headline. On its own it has three problems.
It does not automatically become a cost saving. If an automation frees fifteen hours a week for a customer service rep, but the rep still has a full desk and nothing else changes, the company has not saved money yet. It has saved time that has to be redirected into something valuable before it shows up in the accounts, and that redirection has to be tracked, not assumed.
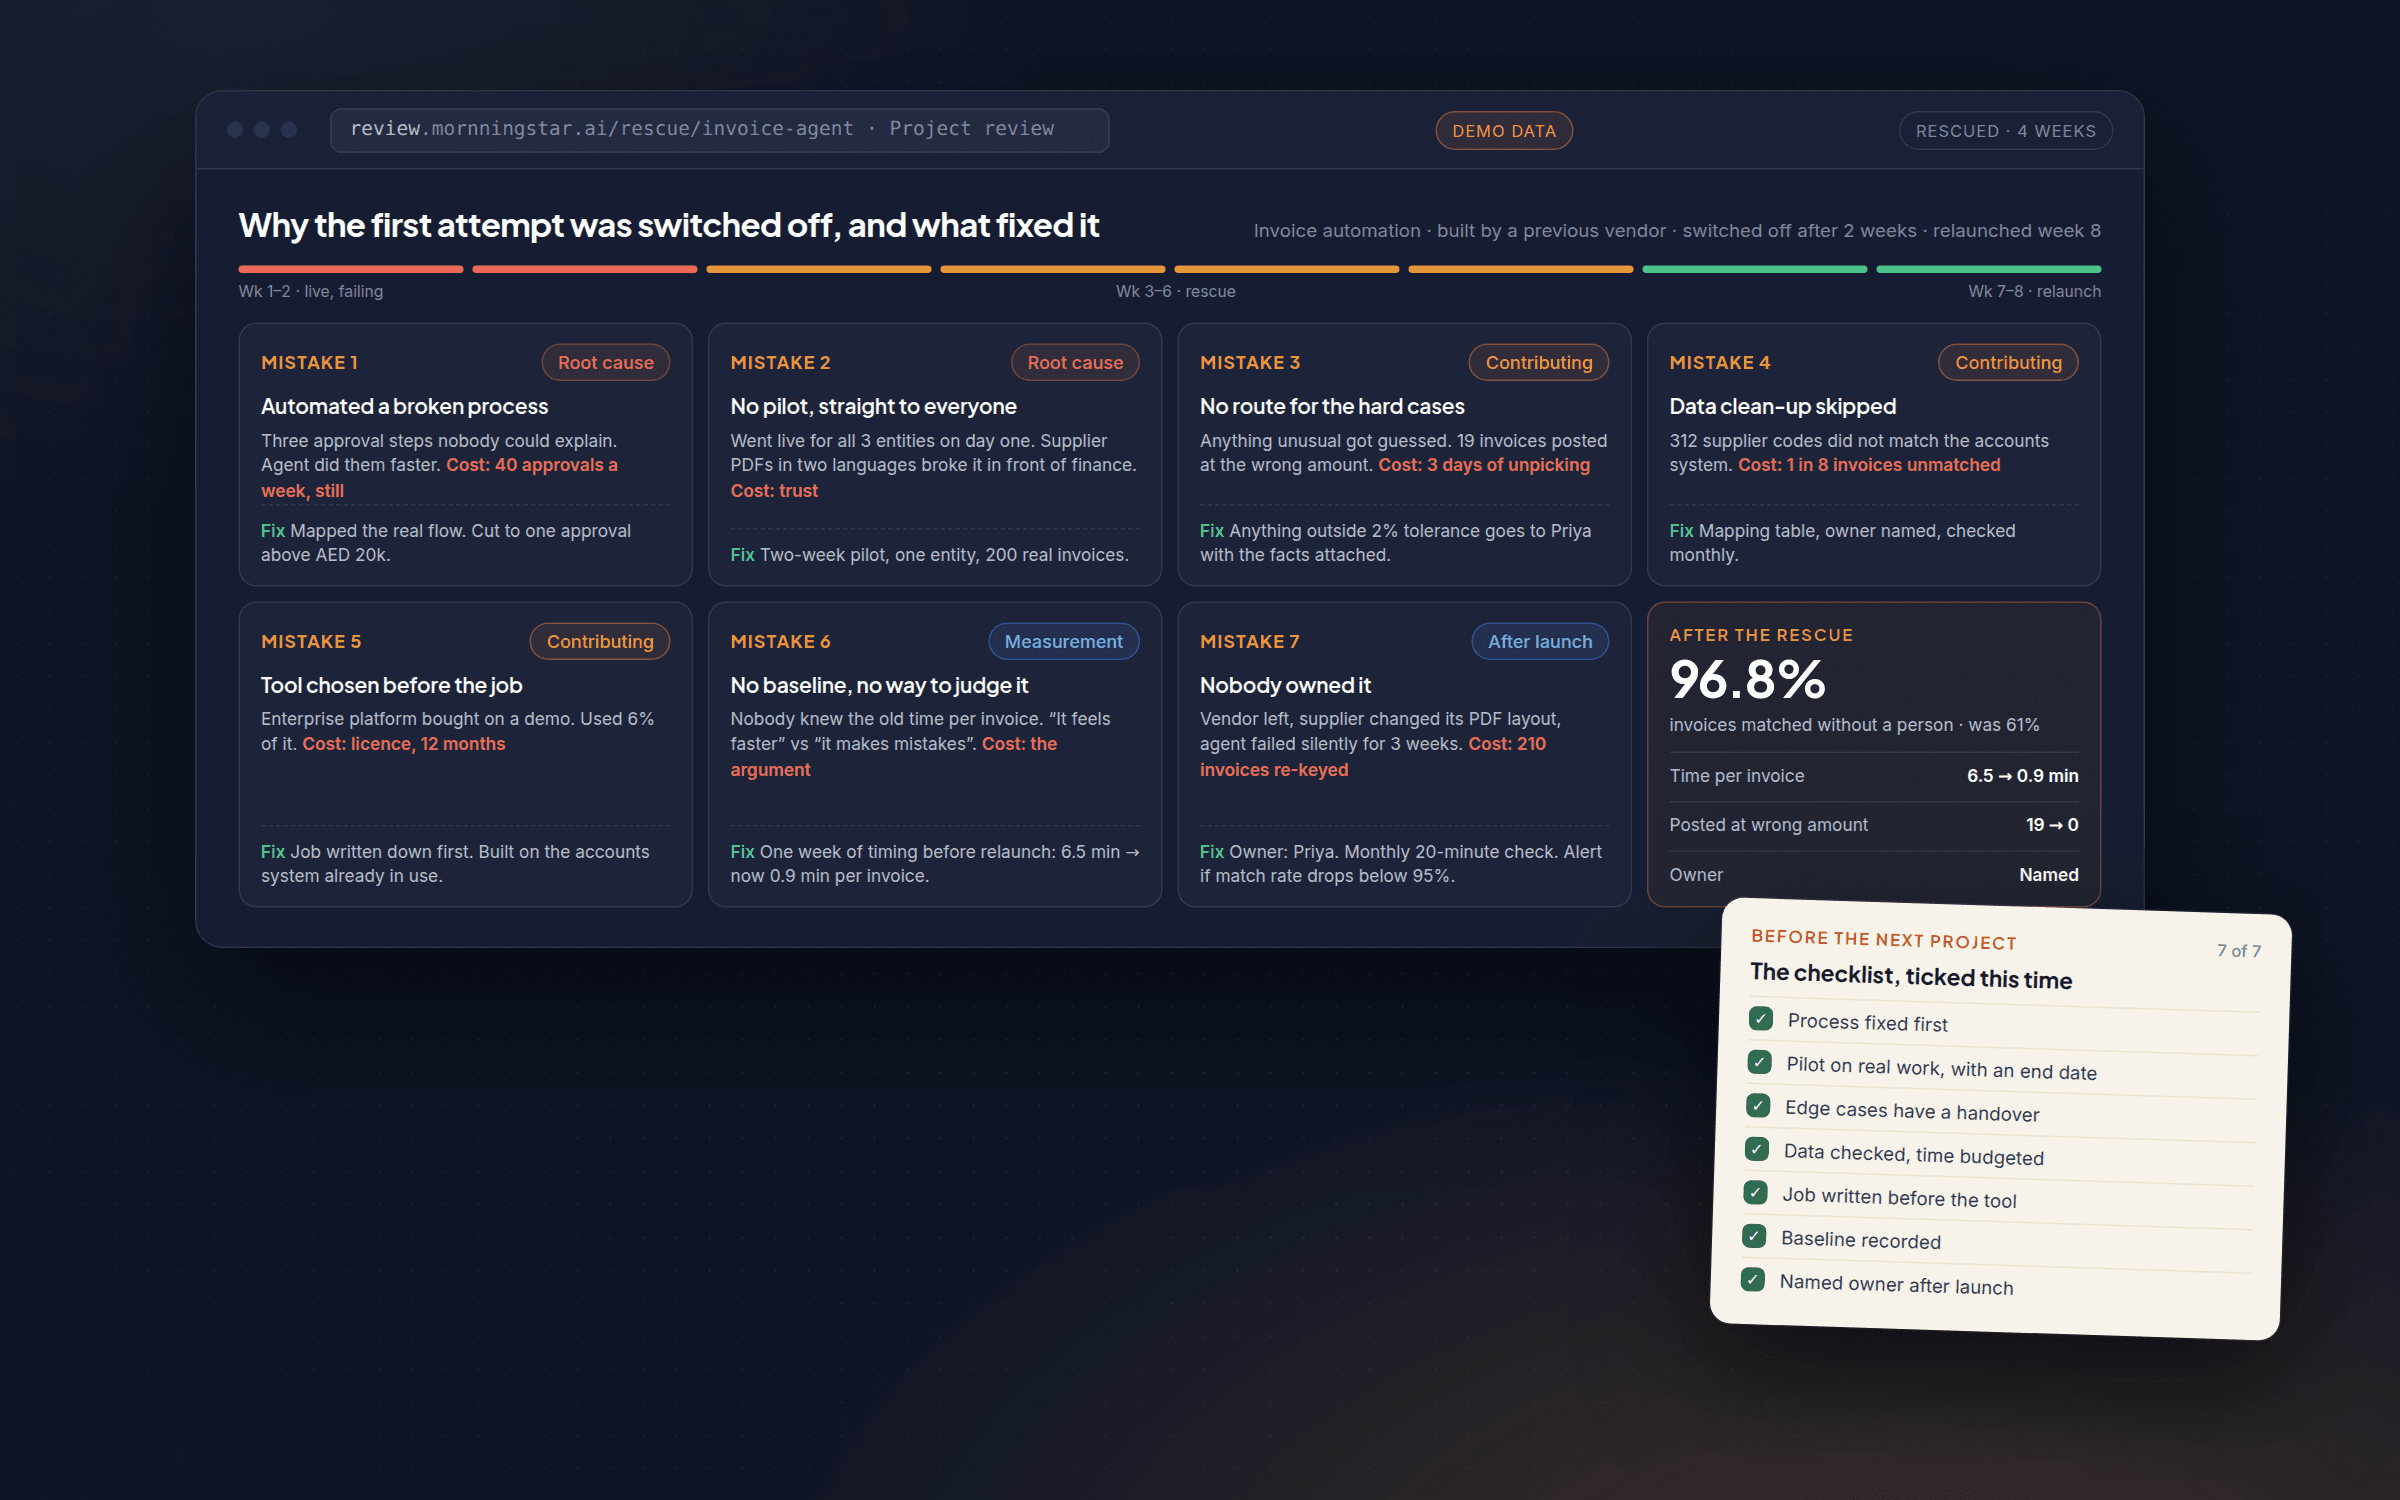
It says nothing about quality. An automation can do a task twice as fast and still be a net loss if it introduces errors someone else has to catch. We see this often enough that it has its own entry in our note on AI automation mistakes.
And it is usually self-reported. Someone guesses a task used to take thirty minutes and now takes five. Without a baseline captured before launch, the thirty-minute figure is often wrong, sometimes badly, in either direction.
None of this makes time saving meaningless. It makes it an input to the return, not the return itself.
The four numbers worth tracking
You do not need a dashboard with thirty measures. Four cover almost everything, and each answers a different question.
1. Cost per task, before and after
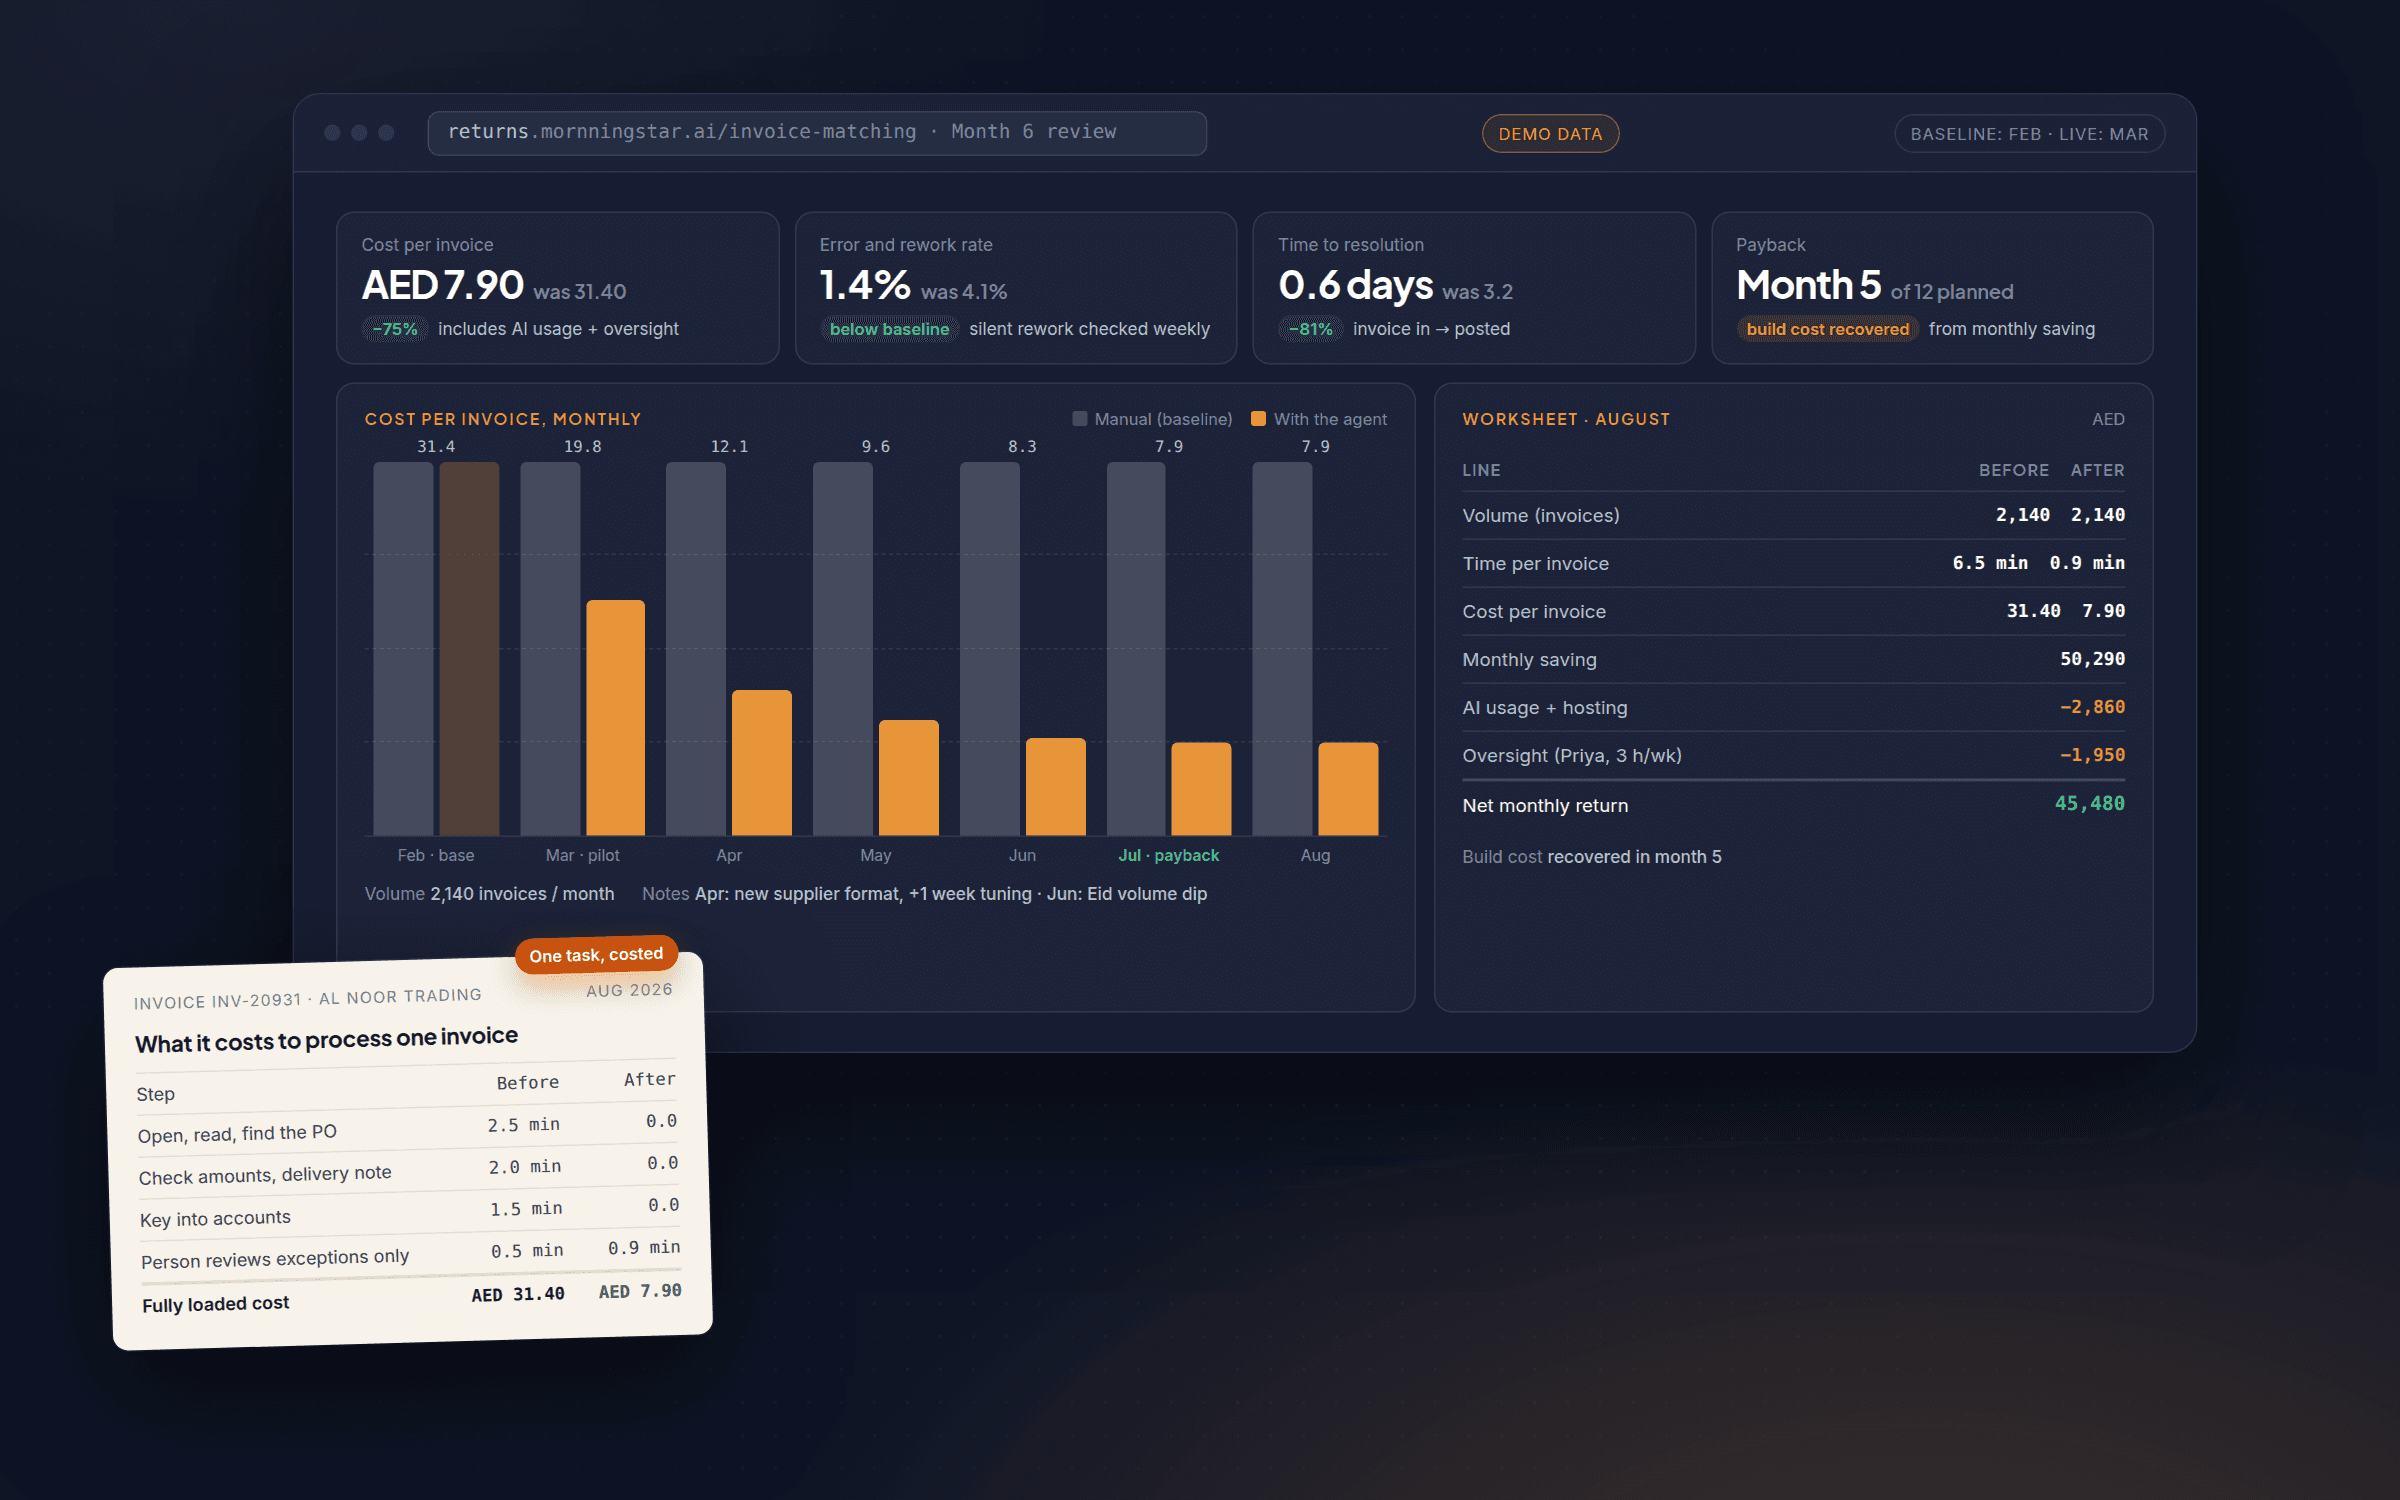
This is what turns hours into money. Take the full cost of doing the task the old way (staff time, software or vendor fees, overhead) and divide by the number of tasks completed in a period. Do the same after launch, including the cost of the AI system itself: the build spread over time, plus usage and maintenance. The comparison is what matters. A task that went from, say, AED 30 to AED 8 is a very different story from one that went from AED 30 to AED 28, even though both show “time saved”. This is also the number most likely to reveal a project that is not paying for itself yet, which is uncomfortable and far more useful than finding out a year later.
2. Error and rework rate
Speed without accuracy moves the cost somewhere else, usually downstream where it is harder to see. Track how often the automation’s output has to be corrected, re-entered, escalated or redone, and compare it with the manual process it replaced. It matters most in the first weeks: error rates are normally a little rough at go-live and improve as the system is tuned. Watch for whether it settles at or below the old baseline. The common trap is a low visible error rate and a high silent rework rate, where people quietly redo the AI’s work without logging it. Ask them.
3. Time to resolution
For anything customer-facing or workflow-based (a ticket, an order, an approval, an onboarding step) track how long it takes from start to finish, not only how long the automated part takes. An agent that answers in ten seconds has not sped anything up if the ticket still sits for two days waiting on a review step it was meant to remove. This is the measure that tells you whether the customer or employee experience actually changed, and an early warning: if cost per task is down but resolution time is not moving, the handover between AI and people needs attention.
4. Revenue or retention impact, where you can trace it
Only where you can draw a reasonably direct line. For automations tied to sales response time, lead follow-up, checkout or churn-risk outreach, it is often possible to compare conversion or retention before and after, provided nothing else major changed in the same period. Where the link is real, this is the number that gets a second and third phase funded, because it moves the conversation from “we are more efficient” to “we kept or grew revenue”. Where it is not, do not manufacture one. A defensible efficiency story is worth more than a return figure that falls apart under questioning.
Set the baseline before launch
Every one of the four depends on a “before” number, and that is the step most teams skip. Nobody wants to spend two weeks measuring the painful old process they are about to get rid of. But without it every “after” number is a guess dressed as a fact.
- Volume: how many of this task happen per day, week or month.
- Time per task: measured, not estimated, ideally from timestamps your systems already produce.
- Cost per task: using the sum above.
- Error and rework rate: how often the current process needs correcting.
- Time to resolution: the full cycle, start to finish.
A week or two of tracking is usually enough. The point is not precision to the decimal; it is a real starting line instead of a remembered impression of how slow things used to be. This is why the first weeks of our 90-day programme include baseline measurement: by the time an automation goes live there is already a clean before picture.
A simple worksheet
A shared spreadsheet with six rows (volume, time per task, cost per task, error and rework rate, time to resolution, revenue or retention impact) and four columns (before, after, change, notes) covers most cases. The sums are short.
Three habits keep the sheet honest. Include the ongoing cost of the AI on the after side: usage fees, hosting, maintenance and any human oversight the new process still needs; leaving these out is the most common way a return figure flatters a project that is not breaking even. Revisit the sheet monthly for at least two quarters, because early numbers move as the system beds in. And use the notes column: if a staffing change, a seasonal spike or an outage affected the month, write it down so the AI is neither credited nor blamed for something unrelated.
The bottom line
Hours saved is a starting signal, not a business case. To know whether an automation paid for itself, track cost per task, error and rework rate, time to resolution and, where the link is real, revenue or retention, from a baseline captured before launch. The worksheet is not complicated. It turns a vague sense that the AI is helping into a number a finance team will trust. Our case studies show what these measures look like on real projects.
Questions
How soon after launch should we expect a return?
What if the time saved is spread across many people?
Should we count avoided hires?

Leads every 90-day programme personally. Writes these notes from the projects that shipped and the ones that did not, so you can skip the second kind.