
A UAE apparel team analysed its own Shopify data and found its best sellers out of stock 39% of the year
A UAE apparel brand selling on Shopify kept running out of its best products and reordered by guesswork. In a guided AI training with MornningStar, the brand's own team exported twelve months of order and stock history, analysed 9,745 SKUs with an LLM using prompts we provided, and found that its top 300 products were out of stock for 141 days a year on average. The team left with a ranked restock list, a 90-day plan, and a method it can run again every month.
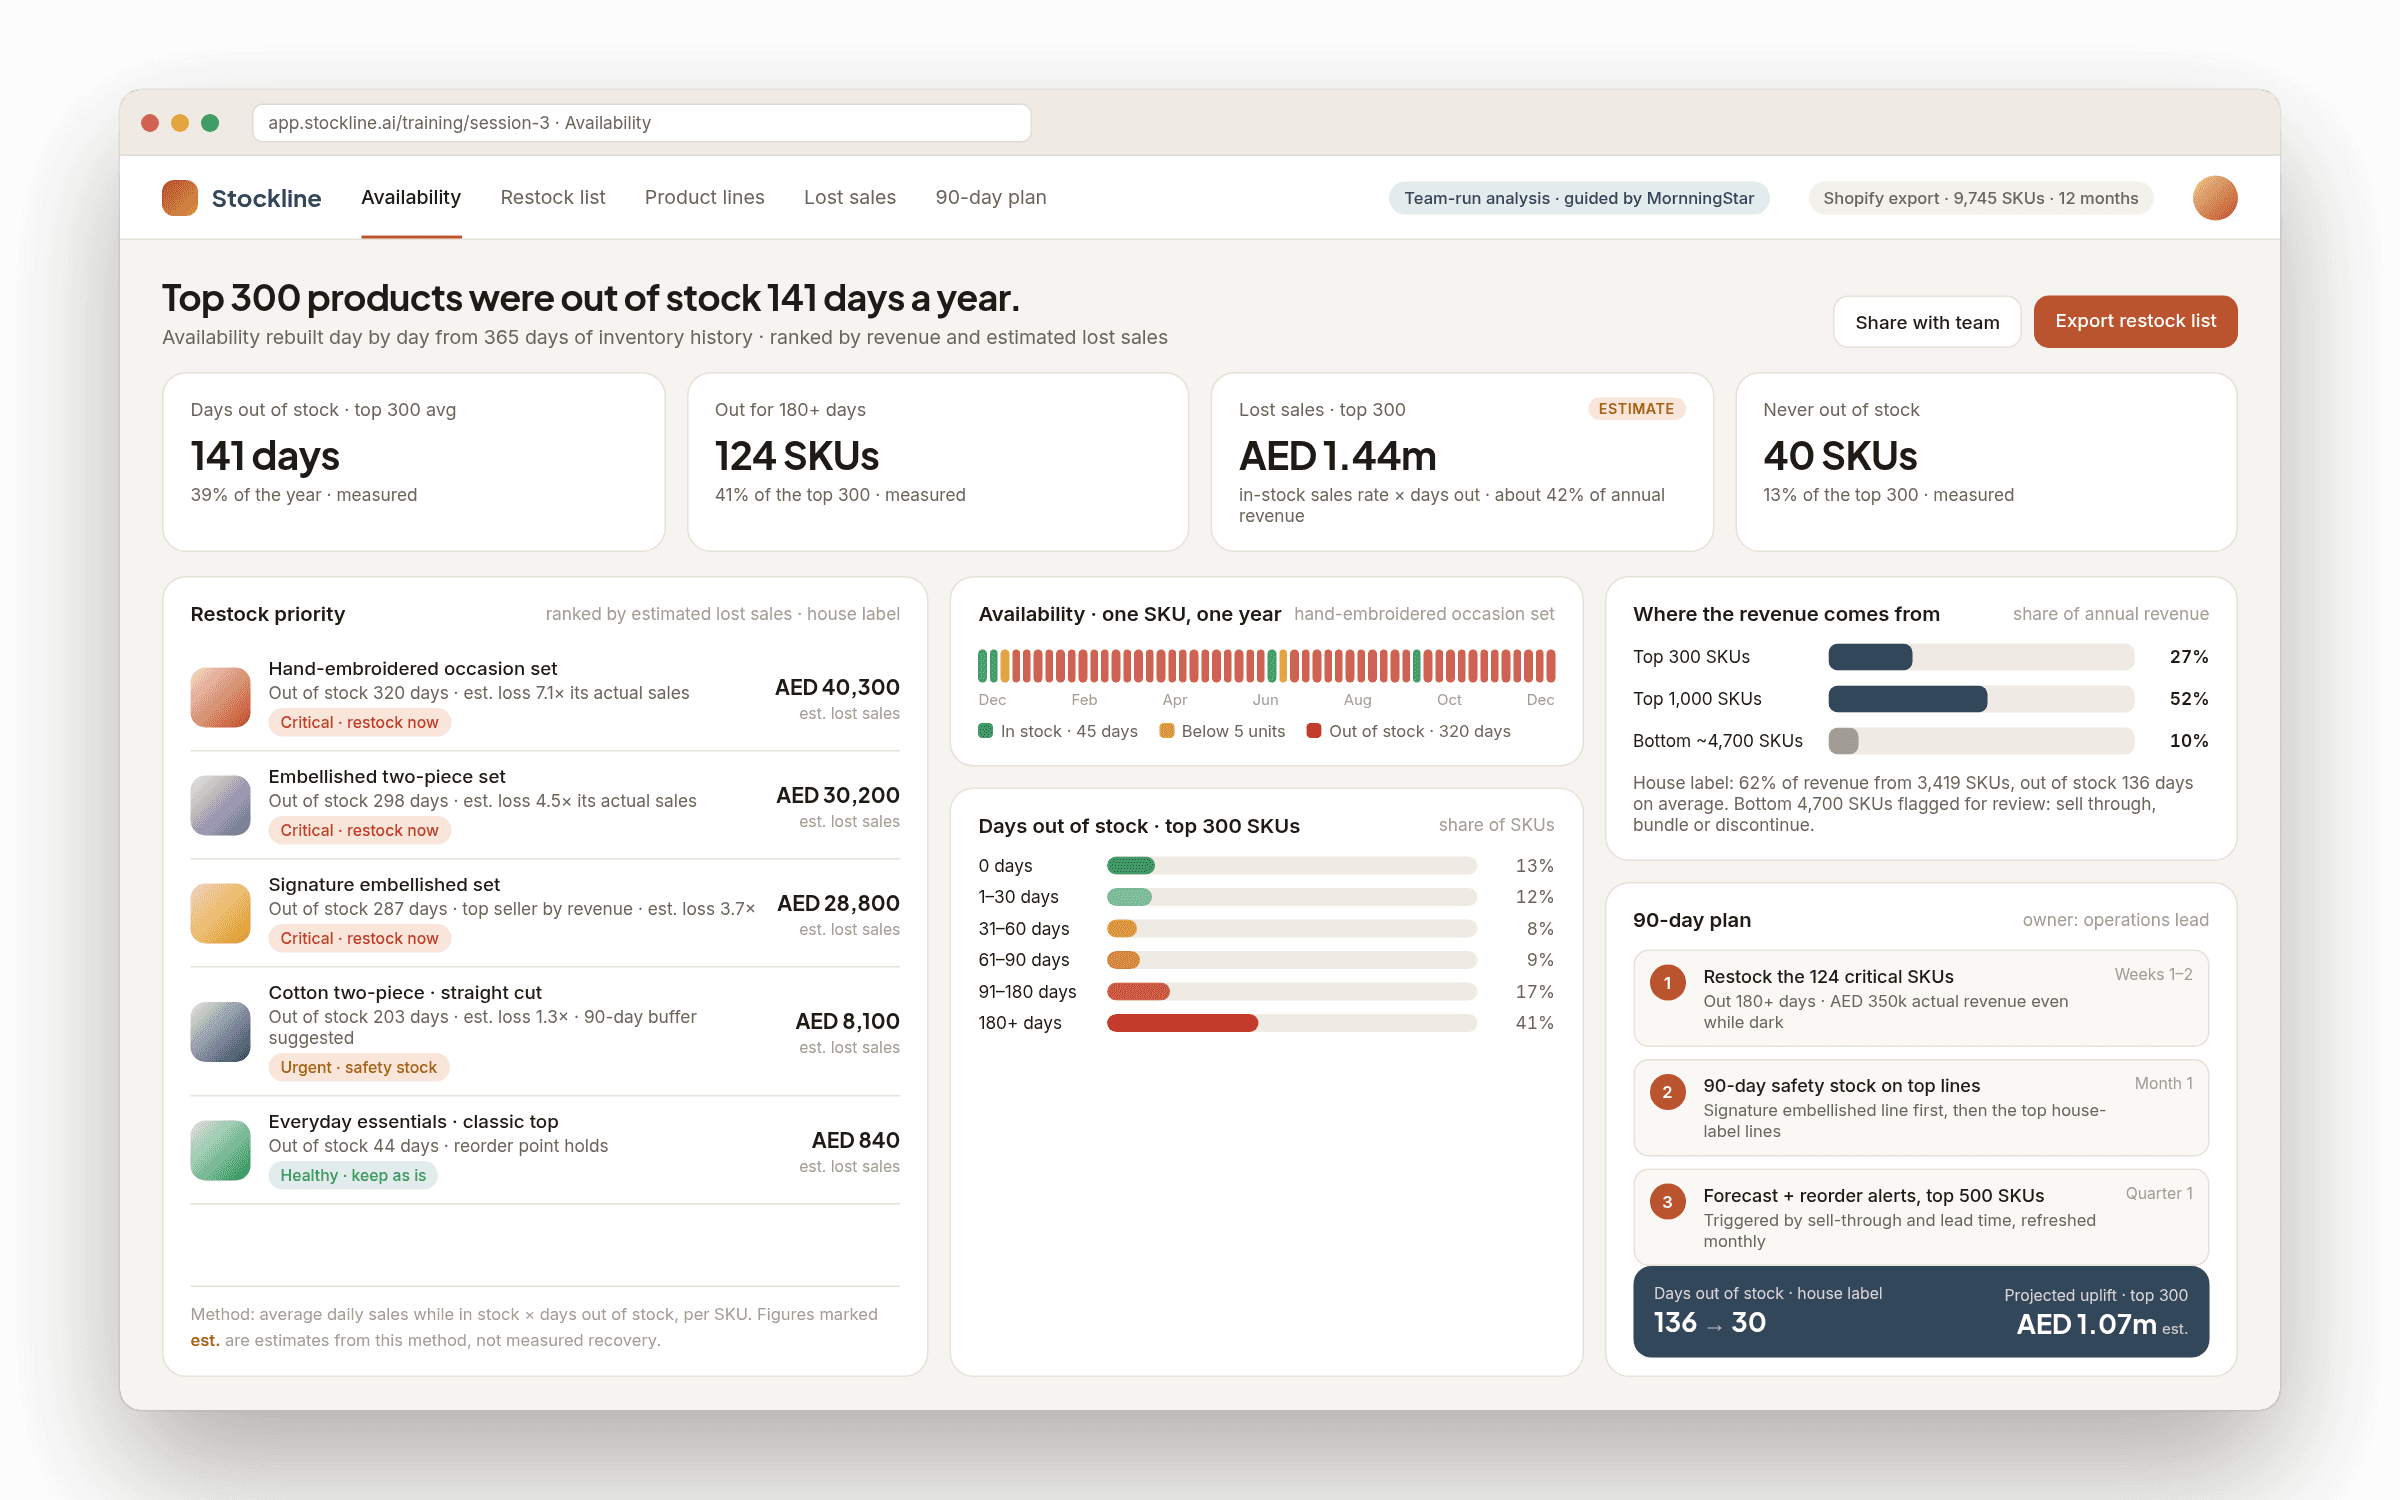
Background
The brand sells its own house label and three third-party labels through a Shopify store, close to ten thousand SKUs in all. Reordering was done from experience and from whatever the team noticed running low. The owners could feel the problem, products kept going dark, but nobody could say which products, for how long, or what it was costing. Rather than commission an outside analysis, the brand took a paid, guided AI training with MornningStar in which its own team did the work on its own data. Delivered December 2025. The brand is not named at its request.
Challenge
Two things made this hard to fix from the inside. Shopify reports what sold, not what would have sold if the product had been on the shelf, so the cost of a stock-out is invisible in every standard report. And with that many SKUs, nobody had time to check availability product by product. The training had to give a non-technical team a way to answer its own question: which products should we be reordering, in what order, and what is it costing us to get this wrong?
The data
The whole analysis ran on data the brand already had. Following our guidance on what to export and how, the team pulled from Shopify: twelve months of orders (24 December 2024 to 23 December 2025), the product catalogue with titles, variants, sizes and colours, and daily inventory levels per SKU. Returns and discount records for the same period were exported alongside, ready for the next pass; this first pass focused on availability.
No new systems, no integrations, no data warehouse. Exports from the store admin, done by the team, were enough.
How the training ran
- Who did what: the team exported the data and ran every analysis step in the LLM using prompts we provided; MornningStar designed the exercise, wrote the prompts, guided the sessions, checked the product groupings and every headline figure, and wrote up the findings and the 90-day plan for the owners
- Step 1, availability: the team used our prompt to have the LLM mark every SKU in stock or out of stock for every day of the year from the inventory history. This produced the number nobody had been tracking: days out of stock per SKU
- Step 2, grouping: with 9,745 product titles too many to sort by hand, the team prompted the LLM to group them into product lines (the signature embellished line, hand-embroidered occasion wear, cotton two-piece sets, everyday essentials) so patterns showed at line level. The groupings were kept in the report so they can be checked
- Step 3, cost of stock-outs: for each SKU, average daily sales while in stock multiplied by days out of stock. A deliberately simple estimate, transparent and repeatable, good enough to rank products by urgency
- Step 4, ranking: every SKU sorted by revenue and by estimated loss, so a ten-thousand-line catalogue became a short list the team could act on
- Write-up: the findings went into a four-part report (the challenge, what the data showed, what it was costing, the plan), built directly from the team's analysis so every chart traces back to a number in the export
Tools used
Shopify admin exports (orders, products, inventory history), an LLM (Claude) running MornningStar's prompts for availability reconstruction, product-line grouping, lost-sales estimates and ranking, MornningStar checking the groupings and headline figures and producing the report.
What the team found
Revenue is concentrated, and the concentration is where the damage is.
| Finding | Figure |
|---|---|
| SKUs analysed | 9,745 |
| Annual revenue | about AED 3.4 million |
| Share of revenue from the top 300 SKUs | 27.4% |
| Share of revenue from the top 1,000 SKUs | 52% |
| Share of revenue from the bottom ~4,700 SKUs | 10% |
| Average days out of stock, top 300 SKUs | 141 days (39% of the year) |
| Top 300 SKUs out of stock for 180+ days | 124 SKUs (41%) |
| Top 300 SKUs never out of stock | 40 SKUs (13%) |
| House label share of revenue | 62%, from 3,419 SKUs |
| House label average days out of stock | 136 days |
| Top 25 house-label SKUs, median days out of stock | 220 days; 15 of the 25 were out for 200+ days |
Measured by the team from the brand's own order and inventory history for the twelve months to 23 December 2025.
In plain words
The products customers most wanted to buy were the ones least likely to be available. Among the brand's twenty-five best-selling house-label products, the typical one was unavailable for seven months of the year. One line, the signature embellished line, accounted for over half of the house label's estimated lost sales on its own.
Meanwhile roughly 4,700 SKUs together produced a tenth of revenue while tying up cash, storage and attention that the top sellers needed. The team had suspected some of this. It had never seen it in numbers, and it had never had the list.
What it was costing
Using the method above, the estimated sales lost on the top 300 SKUs alone came to about AED 1.44 million against annual revenue of about AED 3.4 million, roughly 42% of the year's revenue, or around AED 3,900 of sales for every day of stock-out across those products. Extending the same method to the whole house label gives a larger figure, about AED 4.7 million, which we treat as an upper bound rather than a target, for reasons set out under limitations.
The exact number matters less than the ranking it produces. The estimate made it possible to sort every SKU by how much its absence was costing, which is what turned the catalogue into a short list.
Lost-sales figures assume each product would have kept selling at its in-stock rate for every day it was unavailable. They are a ranking tool and a ceiling, not revenue the brand has recovered.
The 90-day plan
From the findings, the plan came down to four actions in sequence.
- Weeks 1 to 2: priority restock of the 124 critical SKUs, the ones out of stock for 180+ days, which together carried about AED 350,000 of actual revenue even while unavailable for most of the year
- Month 1: a 90-day safety-stock buffer for the signature embellished line and the other top house-label lines, so the best sellers stop going dark between production runs
- Quarter 1: demand forecasting and automated reorder alerts for the top 500 SKUs, built on the same velocity data, so reorders are triggered by expected sell-through and lead time rather than by someone noticing an empty shelf
- Alongside: a rationalisation review of the bottom ~4,700 SKUs, to stop reordering what does not sell and free cash and space for what does
Bring the house label's average days out of stock from 136 down to 30 by the end of the first quarter.
What the plan is expected to change
The training delivered a diagnosis the team produced itself, and a plan. The figures below are projections from the velocity model and the plan's targets. No after-results had been measured at the time of writing; this section will be updated with measured numbers when the brand's next twelve months are in.
House-label average, from the measured 136 days to a target of 30 by the end of the first quarter.
Extra sales from the top 300 SKUs if stock-outs fall to 30 days, from the velocity model. Not a measured result.
Products producing a tenth of revenue between them, marked for sell-through, bundling or discontinuation.
Projected and estimated figures on this page are labelled as such and are not verified results. They come from the brand's own twelve-month data and a stated method, and they can be recomputed by anyone with the same export, but they describe what the plan is designed to achieve, not what has been measured since.
How the plan improves profitability while clearing idle stock
The plan works on both sides of the profit line at once, and it is designed to fund itself. This is how it is meant to work; the results will be measured against it.
First, sales come back where the margin already exists. The 124 critical SKUs and the top house-label lines are products customers already search for and buy without a discount. Keeping them in stock recovers sales at full price with no extra marketing spend, which is the cheapest revenue a brand can add. It also stops paid traffic landing on sold-out pages.
Second, cash comes out of stock that does not move. Roughly 4,700 SKUs produce a tenth of revenue between them but occupy storage, working capital and the team's attention. The rationalisation review sorts them into three groups: sell through and do not reorder, bundle with best sellers to clear, or discontinue. Cash freed here pays for the safety stock on the top lines, so the restock does not need new money.
Third, the stock mix shifts towards velocity. Reorder spend moves from the bottom five thousand SKUs, which earn 10% of revenue, towards the top 500, which earn well over a third. The same inventory budget is expected to turn over faster, hold less dead stock, and carry less markdown risk at season end.
These are the mechanisms the plan relies on, stated so the brand can hold us to them. Whether they deliver the projected uplift depends on execution, production lead times and demand holding at its historical rate.
What the team can now do on its own
This is the part that matters for a training rather than a report. The team now has the exports it knows how to pull, the prompts it has already run once, and the groupings and method written down. Repeating the availability analysis on a fresh export is a matter of running the same steps again. The plan puts the restock list and the safety-stock rules with one named owner on the brand's side, and the forecasting stage is designed to be run by that same person with a monthly refresh.
A one-off report tells a brand what happened last year. A team that can run the analysis every month sees the leak forming and acts before the quarter is lost. That is the difference the training was designed to make.
Limitations, stated plainly
- The lost-sales estimate assumes a product would have kept selling at its in-stock rate for every day it was unavailable. In reality demand shifts, some customers buy a substitute, and cash and production capacity limit how much can be restocked at once. The figure is a ranking tool and a ceiling, not a forecast of recovered revenue
- Product lines were grouped by the LLM from title patterns and checked by MornningStar. A fuller manual review would be needed before any line-level decision involving large spend
- This pass measured lost sales, not lost profit. Margin data was not part of the analysis, so a high-loss SKU is not automatically a high-priority one if its margin is thin
- Sizes, colours, return rates and discounting were exported but not analysed in this pass, so the report says nothing yet about size curves, discount depth or return-driven losses
- The plan's figures are projected. The training delivered a diagnosis and a plan; measured after-results belong to the brand's next twelve months
What the same method covers next
The same twelve-month export supports three further analyses, each of which the team can now run in days with the next set of prompts: size and colour curves per line, so reorders are placed in the right size mix rather than the historical one; return rates by line and by discount depth, to find products that sell only because they are discounted and come back anyway; and margin-weighted prioritisation, so the restock list ranks by profit at risk rather than sales at risk.
Lessons learned
- The biggest leak was in the best sellers, not the long tail. Most inventory advice for D2C brands is about clearing dead stock; here the money was in products the brand already knew how to sell but kept failing to have in stock
- Days out of stock is the metric that was missing. It is not in any standard Shopify report, and once the team had it, the priority list wrote itself
- Twelve months of ordinary exports is enough to start. The brand did not need a new tool, an integration or a data team to find where roughly 40% of its revenue was leaking
- A non-technical team can do this with an LLM and good prompts. Grouping ten thousand titles, running the calculations and producing the charts used to be a specialist's job for weeks. Here the brand's own people did it, with guidance and with the headline figures checked
- Fix availability before forecasting. Forecasting demand for a product that is out of stock half the year produces a forecast of nothing. Reconstruct availability, restock the critical list, set safety stock, then forecast
Run this on your own store
MornningStar's AI Inventory Intelligence Programme is a two-day, hands-on training for a D2C brand's own team, run on the brand's real Shopify data. Your team does the exports and runs the prompts; we guide, check and help turn the findings into a plan. By the end of day two the team has its own availability analysis, its own ranked restock list, a 90-day plan, and the working method to repeat it every month. Price on request.
Currency: the source figures were in Indian rupees. Amounts on this page are converted to UAE dirhams at 26.15 INR per AED (mid-market rate, mid-September 2026) and rounded. Percentages and day counts are unaffected by the conversion. Product lines are described in neutral terms to keep the brand anonymous.
Other work
Ad tracking rebuilt so a beauty brand could sell across India
Two clean signals, one national market
A trust score out of 100 for every loan document
Score with reasons, not a black box
Walk through your apartment before it is built, with the real view from your floor
Each unit type set up in under 7 minutes
Tell us what slows your business down
Thirty minutes on a video call. We will tell you honestly whether AI can help, what it would take, and roughly what it would cost. No slides. No hard sell.