
See why a line slowed down before the shift report is written
Most plants already record what happens on each line. The problem is that nobody has time to read it. This build joins MES, SCADA and maintenance data, works out why a line stopped or slowed, flags quality drift early, and answers questions from the shift lead in plain language.
Background
Mid-sized manufacturers run on a mix of MES, SCADA tags, spreadsheets and paper. Downtime reasons are typed in after the fact, quality issues are found at the end of the batch, and the reason a shift missed its number is worked out days later, if at all.
Challenge
The data is noisy and lives in systems that were never meant to talk. Operators will not use anything that slows them down. And a recommendation is only useful if the maintenance team trusts it, which means every flag must show the evidence behind it.
What we build
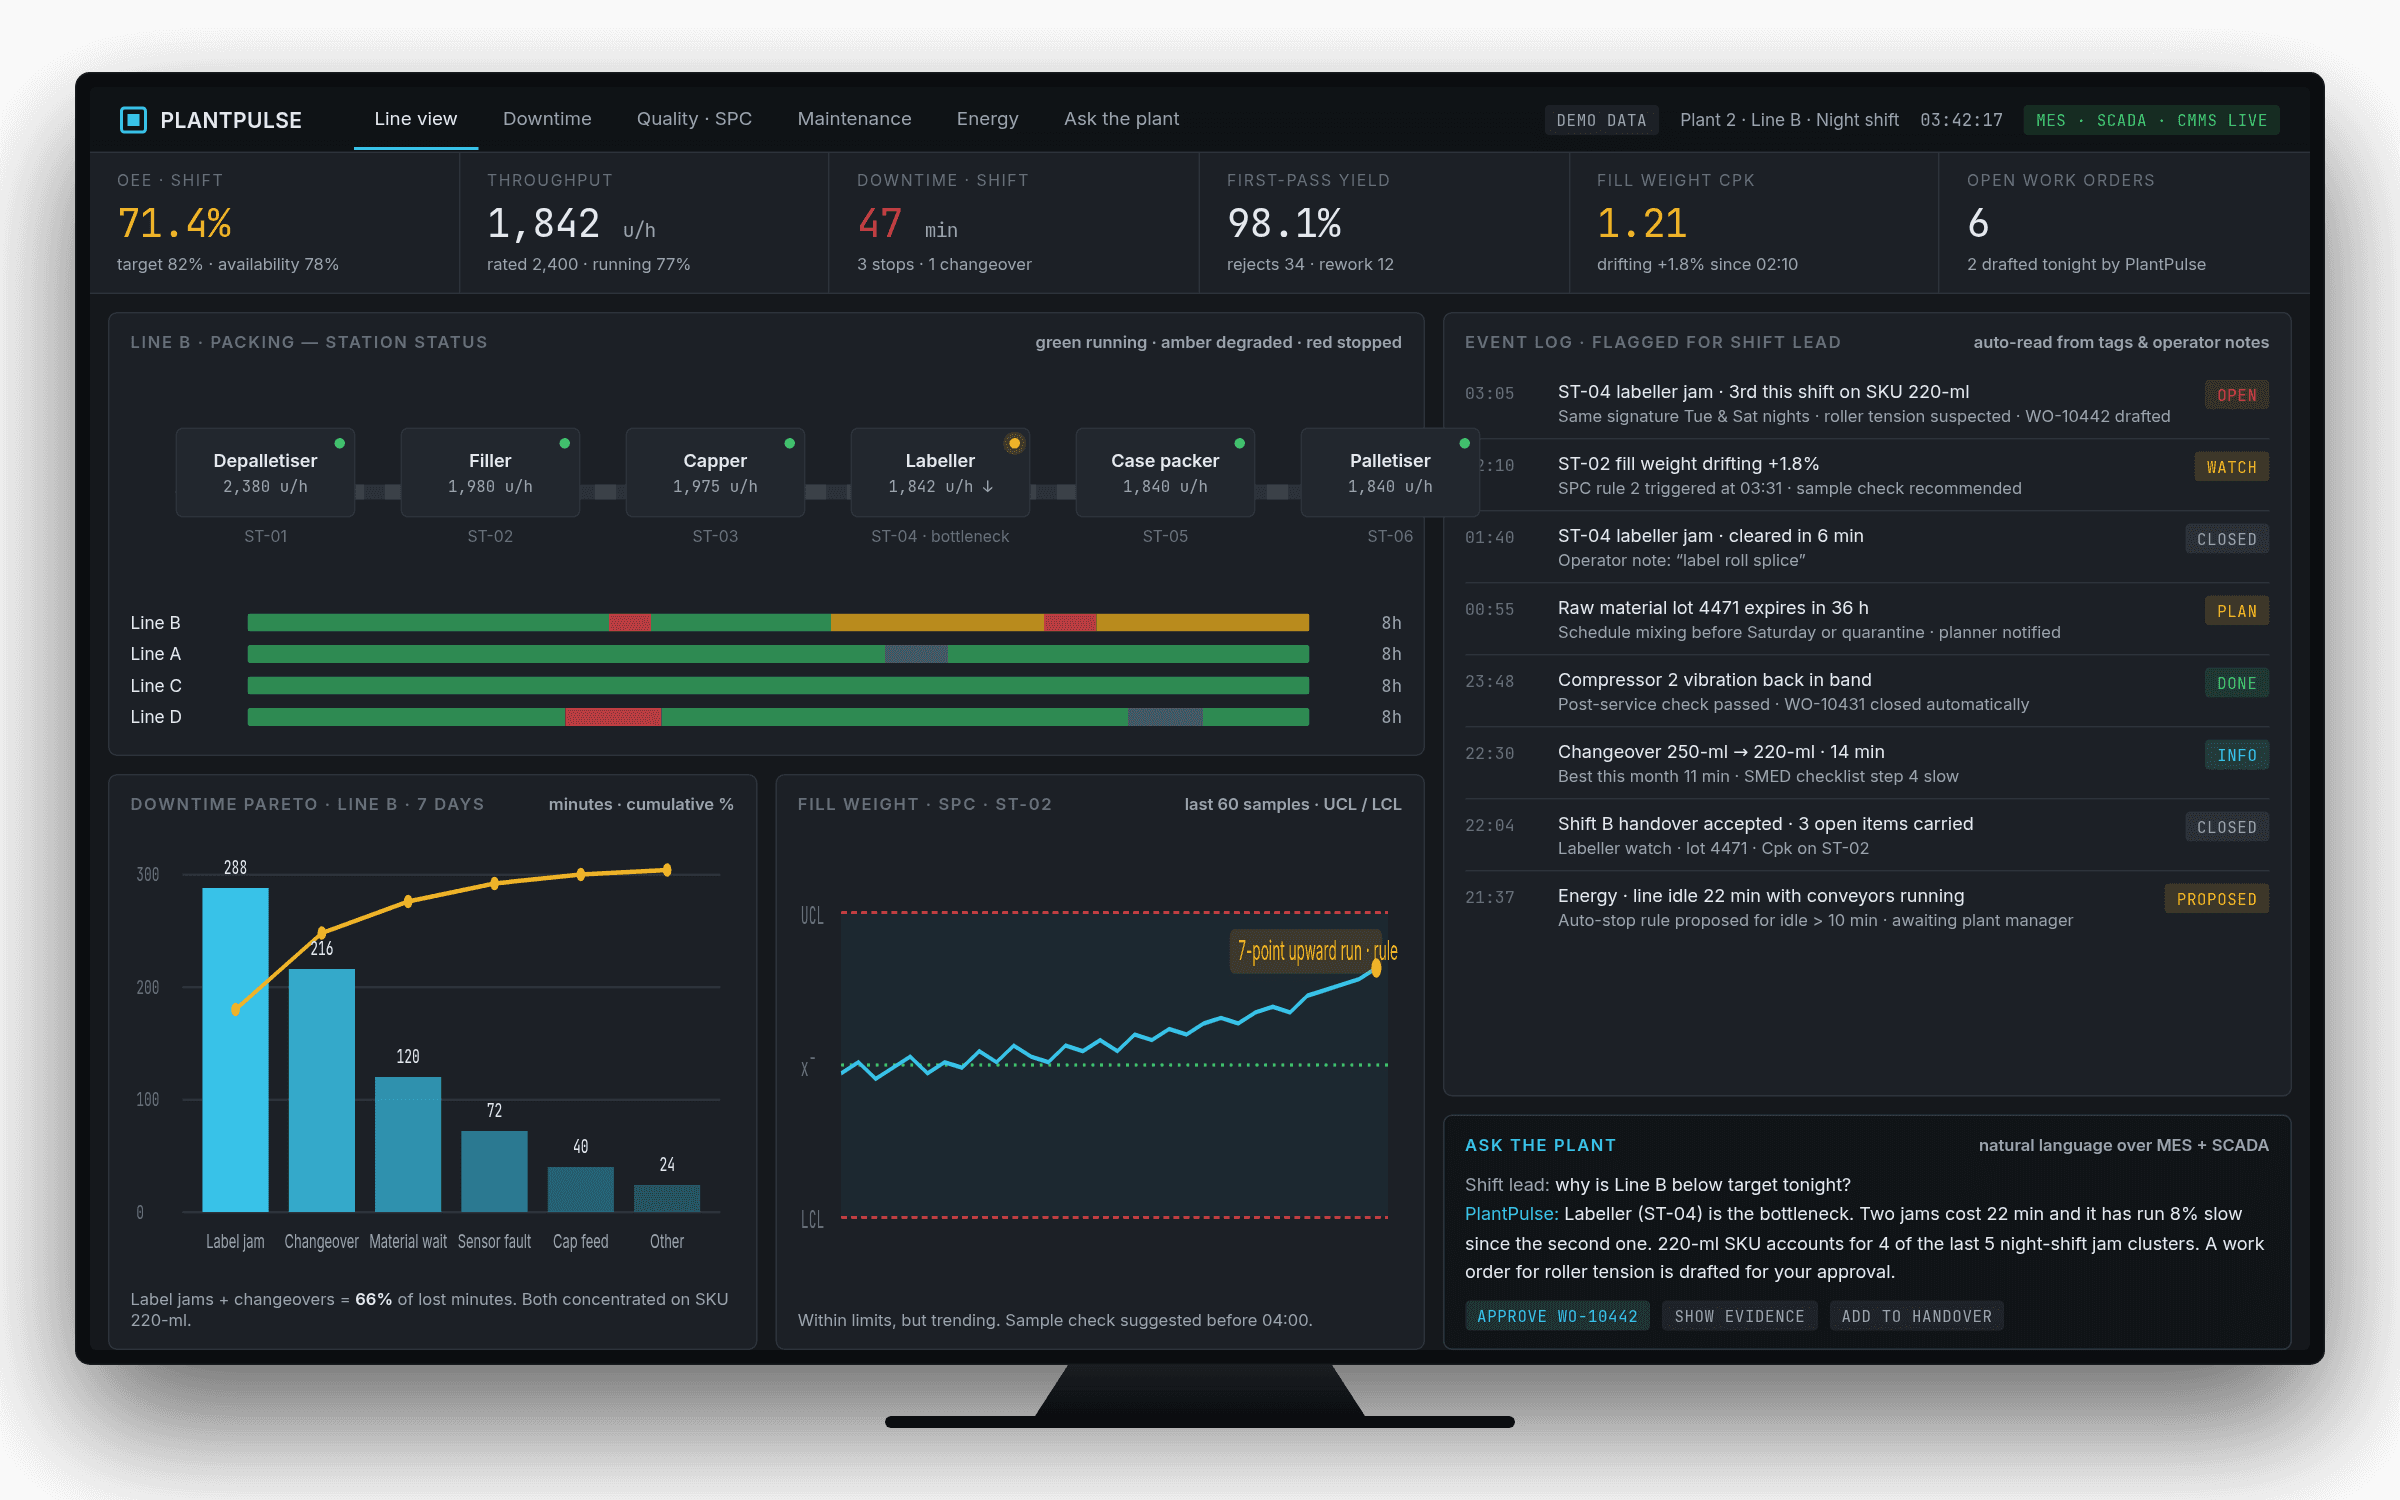
- A live plant wallboard: OEE, throughput and first-pass yield, a station-by-station view that shows where the bottleneck is, and an eight-hour timeline of running, slow and stopped
- Downtime grouped by real cause on a simple Pareto chart, learned from stop codes, sensor tags and operator notes together
- Early warnings for quality drift (control charts that flag a trend before it breaks the limit), material expiry and repeat faults, each with the evidence attached
- Maintenance tickets drafted automatically when a fault repeats, ready for a person to approve
- An “ask the plant” assistant that answers questions like “why was Line B slow tonight?” from the data
- A shift handover note written at the end of each shift, so nothing is lost between teams
How it runs
Connectors to MES and SCADA historians, a time-series store, Claude for cause grouping and plain-language answers, integration with the CMMS for tickets, role-based dashboards for shift leads and plant managers.
What it delivers
Configured to your lines, systems and data before it goes live, and measured against your own shift numbers from the first month.
Downtime explained by real cause, with the evidence, instead of a list of stop codes.
Drift flagged during the run, not after the batch is finished.
The handover note writes itself from what actually happened.
Other work
Ad tracking rebuilt so a beauty brand could sell across India
Two clean signals, one national market
A trust score out of 100 for every loan document
Score with reasons, not a black box
Walk through your apartment before it is built, with the real view from your floor
Each unit type set up in under 7 minutes
Tell us what slows your business down
Thirty minutes on a video call. We will tell you honestly whether AI can help, what it would take, and roughly what it would cost. No slides. No hard sell.